
WiseGold Weekly Pulse | May 22, 2026
Coverage Period: May 15, 2026 (00:00:00 EST) to May 22, 2026 (11:00:00 EST)
WiseGold Capital partners with advisors to assist them in managing assets for their clients. WiseGold Capital is not an asset manager or financial advisor; it is a consulting and logistics firm. Nothing in this publication constitutes investment advice.
Executive Summary
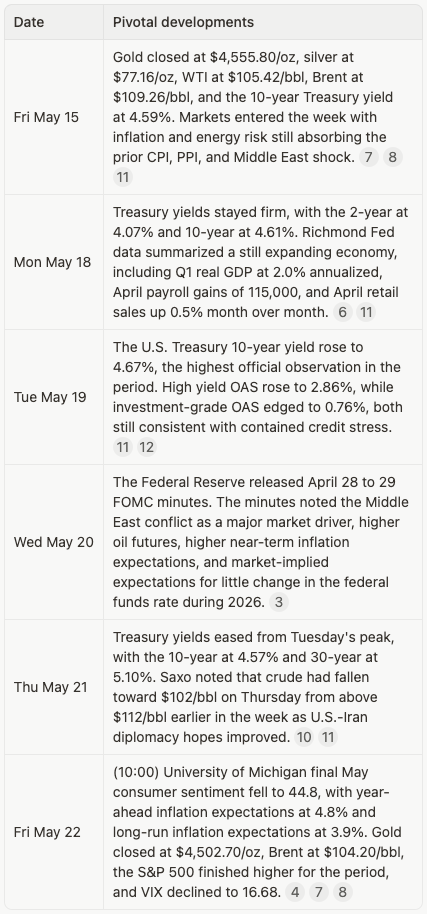
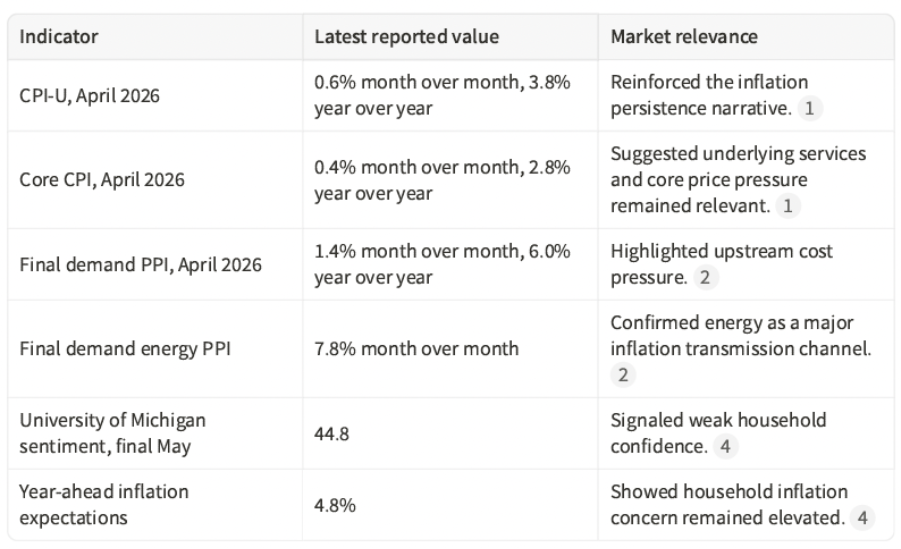
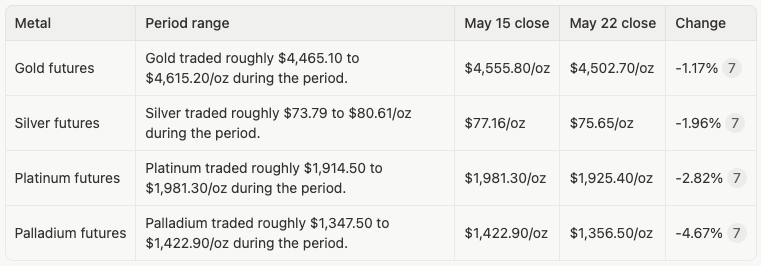
Precious metals ended the week softer despite a still supportive strategic backdrop. Gold held above $4,500/oz at the close, but front-month futures slipped 1.17% from May 15 to May 22 as markets weighed elevated inflation, resilient risk appetite, and a narrow U.S. Dollar Index range. The week was defined by a tension between inflation persistence and geopolitical de-escalation hopes. April CPI and PPI data released before the coverage window continued to shape expectations, with CPI at 3.8% year over year and final demand PPI at 6.0% year over year. The May 20 FOMC minutes reinforced the policy dilemma: the Middle East conflict was cited as a key asset-price driver, oil futures remained elevated, and market-implied pricing showed limited expected policy easing. [1] [2] [3]
Energy was the dominant cross-asset transmission channel. Brent and WTI fell materially during the period, easing inflation pressure and supporting equities, while the VIX declined. Yet EIA assumptions still pointed to constrained Middle East flows, large inventory draws, and Brent averaging around $106/b in May and June. This mix left precious metals in a tactical consolidation phase but preserved their longer-horizon relevance as diversification, purchasing-power defense, and crisis optionality assets. [7] [8] [9]
Key Takeaways
- Gold consolidated above $4,500/oz while real-rate and dollar headwinds persisted.
- Oil retraced sharply, reducing near-term inflation anxiety but not removing supply risk.
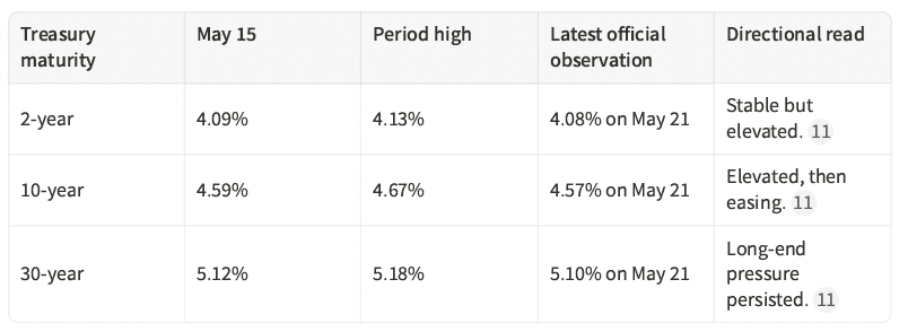
- Treasury yields stayed elevated, with 10-year yields near 4.57% to 4.67%.
- Credit spreads remained contained, signaling limited corporate stress.
- Geopolitics stayed central as Hormuz normalization remained uncertain.
Market & Macro Week-in-Review Timeline
Thematic Deep Dives
Macro & Monetary Policy
The macro picture remained dominated by persistent inflation pressure, geopolitically driven energy uncertainty, and a Federal Reserve reaction function constrained by upside price risks.
- The April 28 to 29 FOMC minutes, released May 20, cited the Middle East conflict as a key driver of asset prices and oil futures. [3]
- The minutes also noted higher near-term inflation expectations and market-implied expectations for little change in the federal funds rate during 2026. [3]
- Market discussion increasingly focused on whether the inflation impulse from energy would be temporary or would affect expectations. [13]
The policy backdrop was not outright hostile to gold, but it was tactically challenging. Elevated front-end and long-end yields raise the opportunity cost of holding bullion, while persistent inflation and geopolitical tail risk sustain gold’s diversification narrative. The result was a market that did not abandon metals, but did demand greater evidence of either lower real yields, renewed risk aversion, or a broader dollar decline.
Inflation & Growth Data
Inflation remained the central macro variable. Although the CPI and PPI releases occurred before the coverage start, they set the tone for this week’s rates, FX, and precious metals behavior.
Growth data were mixed but not recessionary. The Richmond Fed’s May 18 national indicator summary cited Q1 real GDP growth of 2.0% annualized, April payroll gains of 115,000, and April retail sales growth of 0.5% month over month. This combination suggested deceleration risk, not a confirmed contraction. [6]
Rates & Yield Curve Dynamics
Treasury yields remained a key tactical headwind for bullion. Official Treasury data showed the 2-year yield trading from 4.09% on May 15 to 4.08% on May 21, while the 10-year yield moved from 4.59% to 4.57% after reaching 4.67% on May 19. [11]
The curve dynamic mattered because gold’s tactical sensitivity is often linked to real yields and the dollar. Even as oil fell later in the week, rates stayed high enough to cap enthusiasm for metals. A sustained decline in long-end yields would likely improve the setup for gold, while renewed rate-hike pricing would likely remain a near-term headwind.
FX & Dollar Landscape
The dollar was less directional than the rates complex. Yahoo Finance chart data showed the U.S. Dollar Index closing at 99.27 on May 15 and 99.34 on May 22, a modest 0.07% increase. [7]
A flat dollar helped explain why gold’s pullback was orderly rather than disorderly. The currency backdrop did not deliver a strong bullish impulse for metals, but neither did it create a broad dollar squeeze. For internationally priced commodities, this left energy and rates as the stronger drivers of cross-asset behavior.
Energy & Broader Commodities Context
Energy was the week’s central macro lever. Front-month WTI fell from $105.42/bbl on May 15 to $97.50/bbl on May 22, a 7.51% decline. Brent fell from $109.26/bbl to $104.20/bbl, a 4.63% decline. [7]
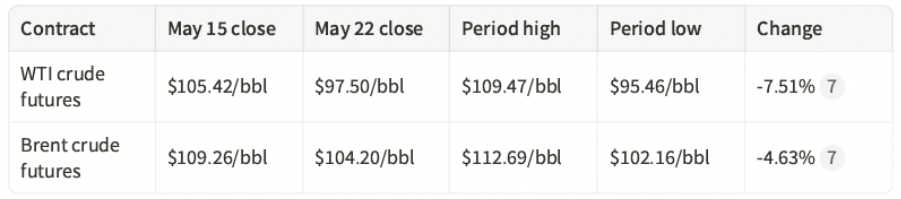
EIA’s May 12 Short-Term Energy Outlook remained the anchor for the broader energy context. It assumed the Strait of Hormuz would remain effectively closed until late May, projected global oil inventories would fall by 2.6 million b/d in 2026, and expected Brent around $106/b in May and June. [8]
The week therefore showed a relief trade, not a full normalization. Lower oil supported risk assets and cooled some inflation fear, but official energy forecasts still pointed to tight supply conditions. This distinction matters for metals because a lower oil tape can reduce near-term inflation hedging demand, while unresolved supply risks preserve crisis-premium potential.
Precious Metals Focus
Precious metals declined across the complex during the period. The move was broad-based, with palladium and platinum underperforming gold and silver.
Positioning data not published or accessible within the window. CFTC COT data for the week ending Tuesday May 19 would normally be published after the Friday 11:00 AM cutoff, and no official weekly ETF flow tonnage was found inside the reporting window. No new verifiable weekly central bank purchase announcement was identified during the coverage period.
Gold’s resilience above $4,500/oz was notable because it occurred alongside elevated Treasury yields and improving equity sentiment. That behavior suggests the market was not rejecting the strategic thesis for metals; rather, it was adjusting near-term pricing to a less acute energy shock and a higher-for-longer rates environment.
Credit & Liquidity
Credit markets did not signal material systemic stress. FRED data showed ICE BofA U.S. High Yield OAS at 2.80% on May 15, 2.86% on May 19, and 2.80% on May 20. The investment-grade corporate OAS was 0.75% on May 15 and 0.75% on May 20. [12]
This stability matters for precious metals because severe credit widening often strengthens safe-haven demand. During this week, however, contained spreads supported a risk-on interpretation. Invesco’s May 22 commentary similarly emphasized tight credit spreads, restrained leverage growth, and strong earnings as signals of underlying resilience. [13]
Equity & Volatility Sentiment
Equity sentiment improved. Yahoo Finance data showed the S&P 500 rising 1.04% from May 15 to May 22, the Nasdaq Composite rising 0.86%, and VIX falling from 18.43 to 16.68. [7]
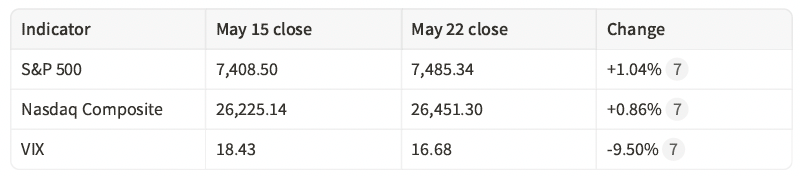
Lower crude and diplomacy hopes helped risk appetite, while corporate earnings and AI-related optimism also supported equities. For metals, this meant less immediate demand for defensive hedges, even though inflation expectations and geopolitical uncertainty remained elevated.
Geopolitics & Strategic Risk
The Middle East conflict and the Strait of Hormuz remained the primary geopolitical market risk. U.S. Bank’s May 14 scenario update stated that constrained Strait traffic kept energy and shipping risks elevated despite the ceasefire, with transit at 6% of normal volume as of May 14. [9]
Saxo’s May 22 update noted that hopes for a diplomatic resolution supported markets, but major hurdles remained. It also observed that crude had fallen sharply earlier in the week before rebounding as uncertainty persisted around Iran’s nuclear position and Strait of Hormuz toll disputes. [10]
The strategic implication is that markets partially priced relief without fully pricing resolution. This leaves cross-asset sensitivity high to shipping normalization, diplomatic setbacks, or renewed military risk.
Structural & Long-Term Themes
The structural case for precious metals remains tied to four overlapping themes: inflation volatility, geopolitical fragmentation, fiscal pressure, and confidence in financial-system resilience. This week reinforced each theme without producing a linear rally in metals.
EIA’s estimate that the Strait disruption could drive significant inventory draws highlighted the fragility of global energy logistics. The University of Michigan inflation expectations data showed that households remain sensitive to price shocks. Treasury yields above 4.5% on the 10-year showed that fiscal and inflation-risk premia remain relevant. [4] [8] [11]
Cross-Asset Interlinkages
- Lower oil prices eased inflation fears, supported equities, and reduced immediate safe-haven demand for gold. [7] [10]
- Elevated Treasury yields raised the opportunity cost of holding bullion, limiting gold upside despite geopolitical risk. [3] [11]
- Stable credit spreads supported risk appetite and reduced demand for crisis hedges. [12] [13]
- Weak consumer sentiment supported the defensive narrative, but risk assets prioritized lower crude and earnings resilience. [4] [7]
- A nearly flat dollar left rates and energy as the primary short-term drivers of precious metals. [7]
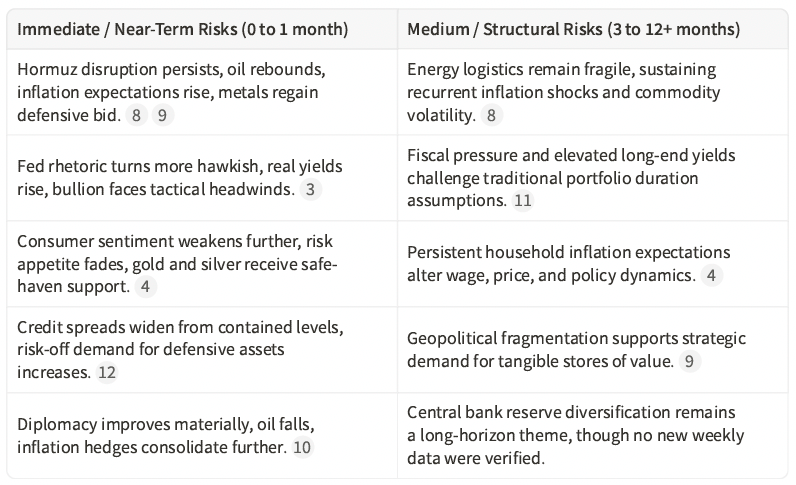
Risk Matrix Snapshot
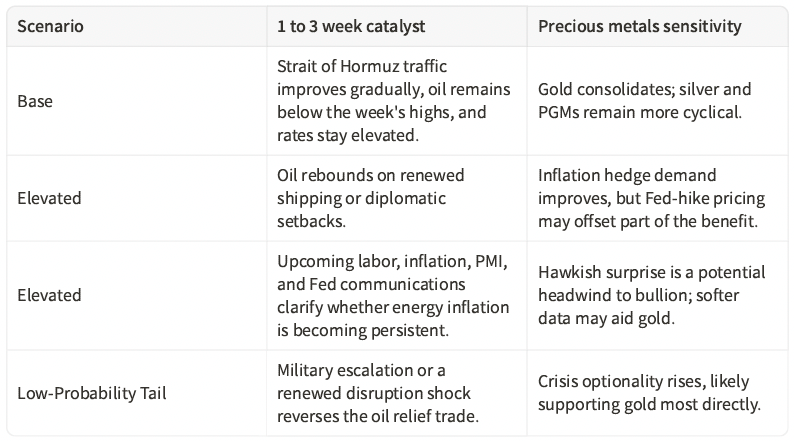
Scenario Watch & Forward Catalysts
Portfolio Context & Implications
This week’s market behavior illustrates why precious metals can occupy a distinct informational role in portfolio construction. They are not simply inflation trades, nor are they only crisis hedges. Gold weakened even as inflation concerns persisted because yields and risk appetite were also important. That nuance matters for advisors and allocators evaluating diversification.
Precious metals may be considered within a broader framework of liquidity, correlation behavior, purchasing-power defense, and geopolitical optionality. The week did not provide a one-directional signal, but it did reinforce the value of monitoring metals alongside rates, energy, credit spreads, and the dollar rather than in isolation.
Precious Metals Strategic Thesis
Diversification Attribute
Gold and related precious metals historically behave differently from equities, credit, and nominal bonds during periods of inflation anxiety or geopolitical stress. This week showed the importance of that role: equities rose and VIX fell, while gold consolidated but remained elevated above $4,500/oz. [7]
Wealth Protection & Purchasing Power
The CPI and PPI backdrop continued to support the purchasing-power discussion. CPI rose 3.8% year over year in April, while final demand PPI rose 6.0% year over year. Energy was a meaningful contributor to both the inflation narrative and market pricing. [1] [2]
Drawdown Mitigation & Crisis Optionality
Geopolitical risk remained unresolved despite better market tone. If energy corridors normalize, the immediate crisis premium may ease. If disruption returns, the optionality value of gold and other tangible hedges may rise. [8] [9] [10]
Structural Demand Drivers
Structural support for precious metals is linked to geopolitical fragmentation, inflation volatility, and confidence in fiat purchasing power. No new verifiable weekly central bank demand data were identified inside the coverage window, so the report does not infer official-sector buying.
Allocation Framing
For institutional and advisory audiences, the relevant framing is not a short-term price target. It is whether precious metals improve portfolio resilience across inflation, rate, geopolitical, and liquidity regimes. Any allocation decision should remain client-specific and should be evaluated alongside liquidity needs, risk tolerance, tax considerations, and broader asset-liability context.
Summary Capsule
- Macro pulse: Inflation pressure remained elevated, while growth data did not confirm recession.
- Metals stance: Gold consolidated but held above $4,500/oz as rates capped upside.
- Risk tone: Equities improved, VIX declined, and credit spreads stayed contained.
- Energy channel: Oil relief supported risk assets but did not eliminate Hormuz risk.
- Positioning nuance: COT, ETF flow, and central bank weekly data were not verifiably available.
- Forward watch: Fed communications, inflation expectations, oil flows, and credit spreads are key.
- Structural theme: Metals remain relevant as diversification and financial-resilience assets.
Source List
[1] Bureau of Labor Statistics, Consumer Price Index Summary, released May 12, 2026, https://www.bls.gov/news.release/cpi.nr0.htm [2] Bureau of Labor Statistics, Producer Price Indexes, released May 13, 2026, https://www.bls.gov/news.release/ppi.nr0.htm [3] Board of Governors of the Federal Reserve System, Minutes of the Federal Open Market Committee, April 28 to 29, 2026, released May 20, 2026, https://www.federalreserve.gov/monetarypolicy/fomcminutes20260429.htm [4] University of Michigan Surveys of Consumers, Final May 2026 Consumer Sentiment, released May 22, 2026, https://www.sca.isr.umich.edu/ [5] Federal Reserve, Federal Reserve issues FOMC minutes press release, May 20, 2026, https://www.federalreserve.gov/newsevents/pressreleases/monetary20260520a.htm [6] Federal Reserve Bank of Richmond, National Economic Indicators, May 18, 2026, https://www.richmondfed.org/research/national_economy/national_economic_indicators [7] Yahoo Finance chart data, Daily futures, FX, equity, and volatility observations for May 15 to May 22, 2026, retrieved May 22, 2026, https://finance.yahoo.com/ [8] U.S. Energy Information Administration, Short-Term Energy Outlook, released May 12, 2026, https://www.eia.gov/outlooks/steo/ [9] U.S. Bank, Iran conflict scenario update: The Strait of Hormuz and market implications, May 14, 2026, https://www.usbank.com/investing/financial-perspectives/market-news/us-stock-market-volatility-continues.html [10] Saxo Bank, Market Quick Take, 22 May 2026, May 22, 2026, https://www.home.saxo/content/articles/macro/market-quick-take---22-may-2026-22052026 [11] U.S. Department of the Treasury, Daily Treasury Par Yield Curve Rates, May 2026 observations, https://home.treasury.gov/resource-center/data-chart-center/interest-rates/TextView?type=daily_treasury_yield_curve&field_tdr_date_value=2026 [12] Federal Reserve Bank of St. Louis FRED, ICE BofA U.S. High Yield and Corporate Option-Adjusted Spreads, retrieved May 22, 2026, https://fred.stlouisfed.org/series/BAMLH0A0HYM2 and https://fred.stlouisfed.org/series/BAMLC0A0CM [13] Invesco, Above the Noise: Solid ground for markets, May 22, 2026, https://www.invesco.com/us/en/insights/solid-ground-markets-strong-earnings.html [14] U.S. Energy Information Administration, Crude oil and petroleum product prices increased sharply in the first quarter of 2026, April 7, 2026, https://www.eia.gov/todayinenergy/detail.php?id=67424
Pending Verification
No unresolved factual claims were included as verified findings. COT positioning, official weekly ETF flow tonnage, and new weekly central bank purchase data were not confirmed inside the reporting window and were therefore not inferred.
Methodology & Notes
This report used public source documents, official statistical releases, official Treasury yield data, FRED credit-spread pages, EIA energy analysis, and market data retrieved from Yahoo Finance chart observations. The coverage window follows the uploaded role instruction and includes the Friday 10:00 AM University of Michigan release. The user’s date reference was interpreted as May 22, 2026 because the current operating date, uploaded role context, and cited market data all align with May 22, 2026.
Futures data are treated as front-month market observations from retrieved chart data and may differ modestly from spot market prints, vendor settlement files, or intraday quotes. Price ranges are approximate period high and low observations from the retrieved daily data.
Disclosure
“This report is for informational purposes only and does not constitute investment advice, a recommendation, an offer, or a solicitation to buy or sell any financial instrument. The views expressed are based on publicly available information believed to be reliable, but accuracy or completeness cannot be guaranteed. Past performance is not indicative of future results. Readers should conduct their own analysis and consult qualified professionals before making any financial decisions.”
#WiseGold #Gold #PreciousMetals #Inflation #Macroeconomics #WealthManagement #PortfolioConstruction #FinancialAdvisors #FamilyOffices #MarketOutlook #Geopolitics #Commodities #RiskManagement #Diversification #WiseGoldCapital