When Oil, Rates, and Inflation Move Together: What This Week’s Precious Metals Repricing Means for Portfolio Strategy

WiseGold Weekly Pulse | May 15, 2026
Coverage Period: May 8, 2026 (00:00:00 EST) to May 15, 2026 (11:00:00 EST)
WiseGold Capital partners with advisors to assist them in managing assets for their clients. WiseGold Capital is not an asset manager or financial advisor; it is a consulting and logistics firm. Nothing in this publication constitutes investment advice.
Executive Summary
The week was defined by a difficult combination for risk assets and precious metals: hotter realized inflation, resilient pockets of real activity, renewed long-end rate pressure, and oil-driven geopolitical risk. April CPI rose 0.6% month over month and 3.8% year over year, while final-demand PPI rose 1.4% month over month and 6.0% year over year, reinforcing the market view that energy disruption was again filtering into inflation psychology and rate expectations [3][4]. Against that backdrop, the 10-year Treasury yield reached 4.54%, its highest level since May 2025, and Brent crude traded near $109/bbl as the Strait of Hormuz remained closed [8]. Gold still retained its strategic-resilience narrative, but the near-term tape weakened as higher yields and a firmer dollar raised the opportunity cost of holding bullion [9].
The macro message was therefore not a simple risk-off story. Employment continued to expand modestly, retail sales remained firm, and industrial production rebounded, but the quality of the expansion was increasingly shaped by cost pressure, energy sensitivity, and policy uncertainty [1][5][6]. For diversified portfolios, the week reinforced the distinction between short-term price vulnerability and long-horizon hedging utility in precious metals.
Key Takeaways
- Inflation surprises revived long-end yield pressure and challenged near-term bullion momentum.
- Oil disruption remained the dominant macro-geopolitical transmission channel.
- Gold weakened despite geopolitical risk as real-rate and dollar pressures intensified.
- Consumer sentiment stayed historically fragile, with gasoline prices prominent in household concerns.
- Strategic metals demand remains distinct from tactical price swings.
Market & Macro Week-in-Review Timeline
- Fri May 8: April payrolls rose 115,000, the unemployment rate held at 4.3%, and prior-month revisions were mixed, with February revised lower and March revised higher [1]. Preliminary University of Michigan sentiment for May fell to 48.2, with year-ahead inflation expectations easing to 4.5% from 4.7%, while consumers continued to cite gasoline prices and tariffs as concerns [2].
- Mon May 11: No materially verifiable scheduled U.S. macro release dominated the official calendar within the sources reviewed. Market attention remained centered on oil supply disruption, Middle East risk, and the week’s coming U.S. inflation data [7][8].
- Tue May 12: April CPI showed broad inflation pressure. CPI-U rose 0.6% m/m and 3.8% y/y, core CPI rose 0.4% m/m and 2.8% y/y, energy rose 3.8% m/m, and food rose 0.5% m/m [3].
- Wed May 13: April PPI confirmed upstream price pressure. Final demand rose 1.4% m/m and 6.0% y/y, with final-demand energy up 7.8% m/m and final demand excluding foods, energy, and trade services up 0.6% m/m [4].
- Thu May 14: Retail sales data showed April retail trade sales at $656.115 billion, seasonally adjusted, while Federal Reserve communications listed multiple public remarks during the week [5][10]. The data mix kept focus on inflation persistence rather than an abrupt demand break.
- Fri May 15: (10:00) Market conditions were shaped by the 9:15 a.m. Federal Reserve industrial production release and the 10:00 a.m. market reaction window. Industrial production rose 0.7% in April, manufacturing output rose 0.6%, and capacity utilization increased to 76.1% [6]. Equity futures weakened as the 10-year Treasury yield hit 4.54%, Brent crude approached $109/bbl, and markets priced a higher chance of a Fed hike later in the year [8].
Thematic Deep Dives
Macro & Monetary Policy
The macro-policy environment shifted toward a more restrictive interpretation of incoming data. Labor demand did not collapse, real activity improved in selected sectors, and inflation moved higher across consumer and producer channels.
- Nonfarm payrolls increased 115,000, while unemployment remained 4.3% [1].
- Industrial production rose 0.7%, reversing March’s 0.3% decline [6].
- Market-implied odds of a 25 bps Fed hike in December more than doubled over the week to about 40%, according to CME FedWatch as cited by Reuters through Kitco [8].
- Federal Reserve officials remained visible publicly, including remarks by Governors Cook, Bowman, Waller, and Barr during the coverage window [10].
The week did not provide a clean growth scare. Instead, it presented a more complex policy challenge: inflation pressure rose while activity indicators remained firm enough to limit near-term expectations for policy relief. That mix tends to increase discount-rate pressure across duration-sensitive assets and can temporarily weigh on gold when real yields and the dollar rise together.
Inflation & Growth Data
Inflation data were the week’s central macro catalyst. The CPI and PPI releases both pointed to renewed price pressure, especially through energy and upstream categories.
- CPI-U rose 0.6% m/m and 3.8% y/y in April [3].
- Core CPI rose 0.4% m/m and 2.8% y/y [3].
- PPI final demand rose 1.4% m/m and 6.0% y/y [4].
- Retail trade sales stood at $656.115 billion in April, seasonally adjusted [5].
The inflation-growth mix supported a higher-for-longer interpretation of policy risk. Retail sales and industrial production suggested that nominal activity was not yet rolling over decisively, but the inflation composition implied that energy costs and supply-chain concerns were again important macro variables.
Rates & Yield Curve Dynamics
Rates were the week’s main cross-asset transmission mechanism. Long-end Treasury yields rose sharply as oil prices and inflation data challenged the disinflation narrative.
- The 10-year Treasury yield hit 4.54%, its highest level since May 2025 [8].
- Global bond yields rose as markets reassessed inflation and growth risks linked to the Middle East conflict [8].
- Higher yields increased the opportunity cost of holding non-yielding bullion and pressured gold on Friday [9].
The curve dynamic was less about a single data point and more about the interaction of oil, inflation prints, and policy credibility. When long-end yields rise because inflation expectations and term premium are being repriced, precious metals can face short-term valuation headwinds even when geopolitical risk is elevated.
FX & Dollar Landscape
The U.S. dollar strengthened as Treasury yields moved higher. That created a direct headwind for dollar-denominated commodities, including precious metals.
- The dollar gained over 1% during the week, making greenback-priced bullion more expensive for non-U.S. buyers [9].
- Dollar strength coincided with a sharp rise in long-end yields and reduced near-term appeal for gold [8][9].
The dollar’s role was defensive and rate-driven rather than purely safe-haven. In this configuration, gold can be caught between two competing impulses: geopolitical demand for stores of value and the mechanical pressure of a stronger dollar plus higher yields.
Energy & Broader Commodities Context
Energy remained the dominant macro-geopolitical channel. The EIA’s May outlook described a severe Middle East supply disruption and assumed the Strait of Hormuz remains effectively closed until late May.
- EIA estimated that Iraq, Saudi Arabia, Kuwait, the UAE, Qatar, and Bahrain collectively shut in 10.5 million b/d of crude production in April [7].
- EIA forecast global oil inventories would decline by 2.6 million b/d in 2026 versus a prior estimate of 0.3 million b/d [7].
- EIA expected Brent around $106/bbl in May and June 2026 [7].
- Reuters market coverage through Kitco reported Brent near $109/bbl on Friday [8].
The energy shock is important because it can tighten financial conditions through multiple channels: headline inflation, consumer sentiment, business input costs, and central-bank reaction functions. This is a classic environment in which inflation hedges may be strategically relevant even when tactical price action is volatile.
Precious Metals Focus
Precious metals traded under pressure into the end of the week as yields and the dollar rose. The move was not inconsistent with the strategic thesis for metals, but it showed the tactical sensitivity of bullion to rates.
- Gold traded roughly $4,619-$4,626/oz around early Friday Reuters-reported spot and futures levels, with broader intraday sources later showing gold nearer $4,548-$4,566/oz before the 11:00 a.m. cutoff [9].
- Silver traded roughly $77.52-$82.08/oz based on accessible Friday market reports [9][11].
- Platinum traded roughly $1,986-$2,043/oz during the Friday reporting window [9][11].
- Palladium traded roughly $1,416-$1,435/oz during the Friday reporting window [9][11].
- Positioning data not published or not accessible within the cutoff window.
- ETF flow and central-bank purchase data not independently verified within the cutoff window.
The key nuance is that precious metals were pressured by precisely the variables that often create their long-term relevance: inflation volatility, geopolitical stress, and policy uncertainty. Gold’s short-term decline reflected rising yields and dollar strength, while the strategic case remained anchored in diversification, liquidity, and resilience against macro regime shifts.
Credit & Liquidity
No materially verifiable credit-stress event dominated the coverage window in the reviewed sources. Liquidity conditions nevertheless tightened at the margin through higher risk-free rates.
- Higher Treasury yields raised discount rates across credit and equity markets [8].
- Energy-price risk raised input-cost concerns for transport, consumer, and industrial borrowers [7][8].
- No verified systemic funding-market disruption was identified within the report window.
Credit markets were not the headline, but they were implicated by the broader repricing. Sustained oil and rate shocks can pressure lower-quality borrowers through weaker margins, higher refinancing costs, and slower real demand.
Equity & Volatility Sentiment
Equities entered Friday vulnerable after a strong AI-led advance. The market tone deteriorated as yields and oil rose together.
- Nasdaq 100 futures fell 1.25%, S&P 500 E-minis fell 0.85%, and Dow E-minis fell 0.49% at 7:18 a.m. ET on Friday [8].
- The S&P 500 and Nasdaq had closed at record highs in the prior session, while the Dow reclaimed the 50,000 level [8].
- Brent near $109/bbl and the 10-year yield at 4.54% created a valuation headwind for growth equities [8].
The equity message was one of vulnerability rather than collapse. Strong earnings expectations, especially in technology, remained a support, but rising real and nominal discount rates challenged the durability of multiple expansion.
Geopolitics & Strategic Risk
Geopolitical risk remained centered on Middle East energy disruption and U.S.-China strategic dialogue. Oil prices provided the most visible market signal.
- EIA assumed the Strait of Hormuz remains effectively closed until late May, with traffic gradually recovering in June [7].
- Reuters coverage through Kitco noted no signs of progress in negotiations to end the Iran-U.S. conflict [8].
- Investors watched the U.S.-China summit, which covered trade, tariffs, Iran, and Taiwan without a major breakthrough [8][9].
The risk regime was defined by strategic chokepoints rather than a purely financial shock. When geopolitical stress directly affects energy prices, the macro consequences can broaden quickly into inflation expectations, consumer behavior, and policy pricing.
Structural & Long-Term Themes
The long-term backdrop remains favorable to the strategic case for precious metals, even when the near-term tape is challenged. Structural themes include fiscal pressure, supply-chain fragmentation, central-bank credibility risk, and geopolitical realignment.
- Energy-security risk reintroduced a visible inflation tail into macro pricing [7].
- Higher nominal yields highlighted the fiscal and term-premium sensitivity of long-duration assets [8].
- Consumer sentiment remained fragile, underscoring the social and political sensitivity of inflation [2].
The week reinforced a core structural point: precious metals are not simply a forecast on CPI. They are also a hedge against policy uncertainty, confidence shocks, currency volatility, and the possibility that inflation and geopolitical risk become mutually reinforcing.
Cross-Asset Interlinkages
- Higher oil prices fed inflation expectations, pushing Treasury yields higher and pressuring equity multiples [7][8].
- Rising yields and a stronger dollar increased the opportunity cost of holding gold [8][9].
- Hot CPI and PPI data reduced confidence in a near-term return to disinflation [3][4].
- Fragile consumer sentiment linked gasoline prices to household confidence and political risk [2].
- Energy disruption supported the long-term precious-metals thesis, even as short-term rate moves weighed on spot prices [7][9].
Risk Matrix Snapshot
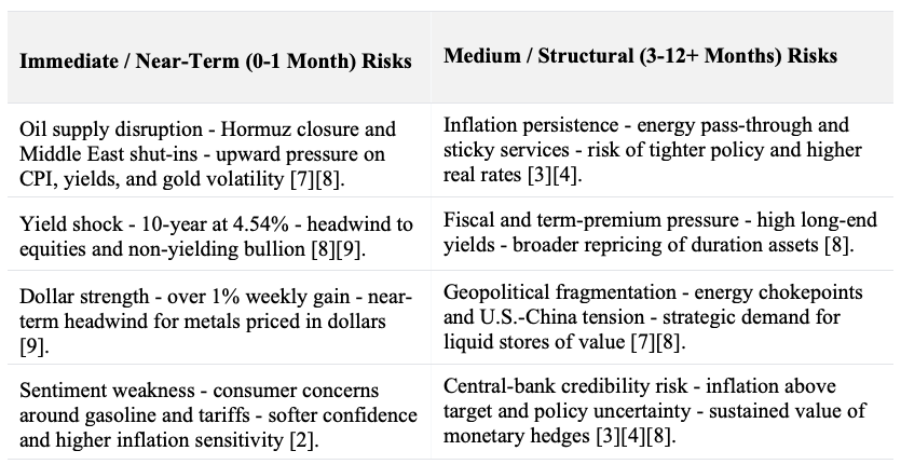
Scenario Watch & Forward Catalysts
- Base: Energy prices remain elevated but do not accelerate materially from current levels. Under this path, metals may remain two-sided: supported by geopolitical hedging demand but capped by yields and dollar strength.
- Elevated: Inflation expectations rise further or Brent holds above the EIA’s May-June forecast region. This could increase rate-hike pricing, pressure equities, and create a mixed metals response in which gold initially faces real-rate headwinds but benefits from diversification demand [7][8].
- Low-Probability Tail: A rapid improvement in Middle East shipping conditions sharply lowers oil prices and yields. That could ease headline inflation pressure, support equities, and reduce near-term safe-haven demand for bullion, while also lowering the opportunity cost of gold.
Forward catalysts over the next one to three weeks include additional Fed communication, incoming energy-security developments around Hormuz, the next inflation-expectations readings, and market monitoring of the U.S.-China strategic agenda.
Portfolio Context & Implications
This week highlighted why precious metals should be evaluated through both tactical and strategic lenses. In the short run, gold and silver can decline when yields and the dollar rise, even if the geopolitical backdrop is supportive. That occurred this week as inflation data and oil-market stress lifted Treasury yields and reduced the relative appeal of non-yielding assets [8][9].
From a portfolio-context perspective, the more important message is that macro correlations can shift quickly. Equities, rates, energy, and metals all became linked through the inflation channel. For allocators focused on diversification and resilience, metals remain relevant as liquid real assets with historically distinct behavior during confidence shocks, currency volatility, and geopolitical stress.
Precious Metals Strategic Thesis
Diversification Attribute
Precious metals can provide differentiated exposure when traditional financial assets are simultaneously pressured by inflation, rates, or geopolitical uncertainty. The week’s joint move in oil and yields illustrated how equity and bond diversification can become less reliable during inflation shocks.
Wealth Protection & Purchasing Power
Gold and silver are often evaluated as long-horizon stores of value rather than income-producing assets. Their usefulness may be clearest when purchasing-power risk, currency volatility, or policy credibility concerns rise. April CPI and PPI reinforced that inflation risk remains active [3][4].
Drawdown Mitigation & Crisis Optionality
The crisis optionality of metals is not the same as guaranteed short-term upside. This week showed that gold can decline during geopolitical stress if yields and the dollar move sharply higher. The portfolio question is therefore about resilience across regimes, not short-term prediction.
Structural Demand Drivers
Structural demand drivers include reserve diversification, geopolitical hedging, long-run monetary uncertainty, and investor demand for tangible stores of value. No new verifiable central-bank purchase data were identified within the cutoff window, so central-bank flow claims are intentionally omitted.
Allocation Framing
Allocation framing should remain generalized and context-dependent. The appropriate role of precious metals varies by liquidity needs, risk tolerance, liabilities, investment horizon, and existing exposures. This report does not provide allocation percentages, recommendations, or trade targets.
Summary Capsule
- Macro pulse: Inflation accelerated while labor and production data remained resilient enough to sustain policy pressure.
- Metals stance: Tactical pressure rose as yields and the dollar strengthened.
- Risk tone: Energy disruption remained the dominant source of macro-geopolitical risk.
- Positioning nuance: COT, ETF, and central-bank flow updates were not independently verified within cutoff.
- Forward watch: Oil, Fed rhetoric, inflation expectations, and U.S.-China developments remain key.
- Structural theme: Metals retain relevance as diversification assets in an unstable inflation-policy-geopolitics regime.
Source List
[1] U.S. Bureau of Labor Statistics — Employment Situation News Release, April 2026 — May 8, 2026 — https://www.bls.gov/news.release/archives/empsit_05082026.htm
[2] Sierra Sun Times, citing University of Michigan Surveys of Consumers — University of Michigan Consumer Sentiment Preliminary Results for May 2026 — May 9, 2026 — https://goldrushcam.com/sierrasuntimes/index.php/news/local-news/77939-university-of-michigan-consumer-sentiment-preliminary-results-for-may-2026-collapses-under-president-trump-to-an-all-time-low-fueled-by-soaring-prices-at-the-pump
[3] U.S. Bureau of Labor Statistics — Consumer Price Index Summary, April 2026 — May 12, 2026 — https://www.bls.gov/news.release/cpi.nr0.htm
[4] U.S. Bureau of Labor Statistics — Producer Price Index News Release, April 2026 — May 13, 2026 — https://www.bls.gov/news.release/archives/ppi_05132026.htm
[5] Federal Reserve Bank of St. Louis FRED, source U.S. Census Bureau — Advance Retail Sales: Retail Trade (RSXFS), April 2026 — updated May 14, 2026 — https://fred.stlouisfed.org/series/RSXFS
[6] Board of Governors of the Federal Reserve System — Industrial Production and Capacity Utilization, G.17 — May 15, 2026 — https://www.federalreserve.gov/releases/g17/current/
[7] U.S. Energy Information Administration — Short-Term Energy Outlook — May 2026 — https://www.eia.gov/outlooks/steo/
[8] Kitco News, by Reuters — Nasdaq, S&P 500 futures tumble as yields jump on inflation worries — May 15, 2026 — https://www.kitco.com/news/off-the-wire/2026-05-15/nasdaq-sp-500-futures-tumble-yields-jump-inflation-worries
[9] MarketScreener, by Reuters — Gold heads for weekly loss on oil-driven inflation fears; markets eye Trump-Xi talks — May 15, 2026 — https://www.marketscreener.com/news/gold-heads-for-weekly-loss-on-oil-driven-inflation-fears-markets-eye-trump-xi-talks-ce7f5bd2db8af625
[10] Board of Governors of the Federal Reserve System — May 2026 Calendar of Events — May 2026 — https://www.federalreserve.gov/newsevents/2026-may.htm
[11] Fortune — Current price of silver as of Friday, May 15, 2026 — May 15, 2026 — https://fortune.com/article/current-price-of-silver-5-15-2026/
Methodology & Notes
This report was compiled from official U.S. statistical releases, Federal Reserve materials, EIA energy outlook data, and accessible market coverage from Reuters republications. The coverage period follows the user-specified Friday 00:00:00 EST to Friday 11:00:00 EST window. Friday 10:00 a.m. market-relevant information was included where available before cutoff, with particular attention to the post-9:15 a.m. Federal Reserve industrial production release and market reaction during the 10:00 a.m. hour.
Price ranges for precious metals are approximate because intraday spot and futures data vary by venue, timestamp, and publication. Where exact weeklong high-low data were not independently accessible, ranges were limited to verified Friday reporting-window values and explicitly described as approximate. COT, ETF flow, and central-bank purchase data were omitted because they were not independently verified within the cutoff window.
Disclosure
This report is for informational purposes only and does not constitute investment advice, a recommendation, an offer, or a solicitation to buy or sell any financial instrument. The views expressed are based on publicly available information believed to be reliable, but accuracy or completeness cannot be guaranteed. Past performance is not indicative of future results. Readers should conduct their own analysis and consult qualified professionals before making any financial decisions.
#WiseGold #PreciousMetals #Gold #Inflation #TreasuryYields #Commodities #PortfolioStrategy #RiskManagement #WiseGoldCapital