WiseGold Weekly Pulse | June 12, 2026
Coverage Period: Jun 5, 2026 (00:00:00 EST) to Jun 12, 2026 (11:00:00 EST)
WiseGold Capital partners with advisors to assist them in managing assets for their clients. WiseGold Capital is not an asset manager or financial advisor; it is a consulting and logistics firm. Nothing in this publication constitutes investment advice.
About WiseGold
The WiseGold Weekly Pulse is published by WiseGold Capital, a consulting and logistics firm that partners with financial advisors, family offices, and money managers to facilitate access to physical precious metals as part of a broader wealth preservation and portfolio diversification framework. Additional resources, including institutional-grade market commentary, educational content on precious metals fundamentals, and information on WiseGold’s advisory support services, are available at https://wise.gold.
Executive Summary
The week of June 6 to June 12, 2026 (Coverage Period), was dominated by a confluence of geopolitical escalation and hotter-than-expected inflation data, triggering significant cross-asset volatility. The conflict between the United States and Iran intensified with renewed strikes, exacerbating concerns over energy supply and driving wholesale and consumer inflation to multi-year highs. The May Consumer Price Index (CPI) rose to 4.2% annually, while the Producer Price Index (PPI) surged to 6.5%, cementing a “higher for longer” narrative regarding US interest rates. Consequently, benchmark Treasury yields climbed, and the US Dollar Index (DXY) found support near 99.3. Precious metals faced severe headwinds from the robust US labor market report and hawkish rate expectations, leading to substantial sell-offs across gold, silver, platinum, and palladium. Meanwhile, the European Central Bank (ECB) executed a 25 basis point rate hike, citing war-driven inflation pressures, and the Bank of Japan (BOJ) is widely expected to raise its policy rate to a 31-year high of 1.0% next week.
Key Takeaways
- US inflation accelerated to 4.2% in May, driven by energy shocks from the US-Iran conflict.
- Robust US payrolls (172K) reinforced expectations of prolonged restrictive monetary policy.
- Precious metals sold off sharply as rising yields and a stronger dollar dented safe-haven appeal.
- ECB raised rates by 25 bps to 2.25%, revising inflation forecasts upward.
- Geopolitical risks remain elevated amid ongoing US-Iran strikes and energy market disruptions.
Market & Macro Week-in-Review Timeline
- Fri Jun 6 (Prior Friday carry-over): The May nonfarm payrolls report, released June 5 (prior Friday), showed 172,000 jobs added versus 85,000 expected, with unemployment steady at 4.3%. The data continued to reverberate through markets at the opening of the coverage period, triggering a sharp sell-off in precious metals [1].
- Mon Jun 8: Precious metals stabilized temporarily as markets braced for upcoming inflation data and the impending Federal Open Market Committee (FOMC) meeting [2].
- Tue Jun 9: Silver prices fell by over 6% to an intraday low of $64.47, reflecting heightened sensitivity to rising interest rate expectations and industrial headwinds [2].
- Wed Jun 10: May CPI report revealed annual inflation hit a three-year high of 4.2%, causing gold to plunge nearly 4.5% to close at $4,071.38 [2] [3].
- Thu Jun 11: May PPI data showed wholesale inflation surging to 6.5% year-over-year; ECB hiked key interest rate by 25 bps to 2.25% [2] [4].
- Fri Jun 12 (10:00): University of Michigan Consumer Sentiment Preliminary reading released; markets continued to digest the implications of the US-Iran conflict and impending central bank decisions [5] [6].
Thematic Deep Dives
Macro & Monetary Policy
The macroeconomic landscape is currently dictated by sticky inflation and resilient labor markets, complicating central bank mandates. The US Federal Reserve, under the new leadership of Chair Kevin Warsh, faces a challenging environment as inflation re-accelerates.
- US economy added 172,000 jobs in May, double the projected 85,000.
- Fed Chair Warsh has indicated a preference for alternative inflation metrics, though traditional gauges remain elevated.
- Markets anticipate the Fed will maintain the federal funds rate at 3.50% to 3.75% through year-end. The robust employment data and surging inflation have effectively priced out near-term rate cuts in the US. Investors are keenly focused on the upcoming FOMC meeting for signals regarding the future policy path, particularly any shifts in the committee’s easing bias [1] [7].
Inflation & Growth Data
Inflationary pressures have resurged globally, primarily fueled by energy market disruptions stemming from geopolitical conflicts. The US saw significant upward movements in both consumer and wholesale prices.
- US May CPI rose 0.5% monthly, pushing the annual rate to 4.2%.
- Core CPI, excluding food and energy, increased 2.9% year-over-year.
- US May PPI jumped 1.1% month-over-month, bringing the annual rate to 6.5%. The energy shock caused by the US-Iran conflict is a major driver of this inflationary spike. The data underscores the difficulty central banks face in returning inflation to target levels without inducing economic contraction [2] [3].
Rates & Yield Curve Dynamics
Bond markets reacted swiftly to the hotter inflation and jobs data, adjusting expectations for the trajectory of interest rates. Yields on US Treasuries moved higher across the curve.
- The 10-year Treasury yield rose above 4.46%.
- The 30-year Treasury bond yield climbed past 5.04%.
- The yield curve remains a focal point as investors weigh inflationary pressures against growth prospects. The upward shift in yields reflects a market consensus that restrictive monetary policy will persist. The rise in long-dated yields also indicates growing concerns over structural inflation and geopolitical risks [8] [9].
FX & Dollar Landscape
The US dollar exhibited strength against major peers, supported by higher Treasury yields and the “higher for longer” interest rate narrative.
- The US Dollar Index (DXY) found support near 99.3.
- The Euro faced pressure despite the ECB’s rate hike, given the eurozone’s downward growth revisions.
- The Japanese Yen remains weak, prompting expectations of a BOJ rate hike. The dollar’s resilience is a direct consequence of the robust US economic data and the resulting shift in monetary policy expectations. A stronger dollar continues to act as a headwind for dollar-denominated commodities [10] [11].
Energy & Broader Commodities Context
Energy markets experienced heightened volatility due to the escalating conflict in the Middle East. Oil prices fluctuated wildly based on geopolitical headlines.
- US crude oil futures declined 3.4% to close at $88.20 per barrel earlier in the week.
- Brent futures lost 2.97% to settle at $91.45.
- Prices rebounded later in the week following renewed US strikes against Iran. The potential for prolonged disruptions in the Strait of Hormuz remains a critical risk factor for global energy supplies. The resulting energy price shocks are the primary catalyst for the recent surge in global inflation metrics [12] [13].
Precious Metals Focus
Precious metals suffered significant declines this week as the combination of a strong jobs report, hot inflation data, and a resilient US dollar triggered widespread liquidation.
- Gold: Traded roughly $4,070 to $4,500/oz. The yellow metal broke below its 200-day simple moving average following the payrolls shock.
- Silver: Traded roughly $63.40 to $74.00/oz. Silver experienced sharper percentage drops than gold, reflecting its higher volatility and industrial exposure.
- Platinum: Traded roughly $1,715 to $1,938/oz.
- Palladium:Traded roughly $1,195 to $1,306/oz. Positioning data suggests institutional investors reduced exposure in response to the shifting macroeconomic backdrop. Central bank demand trends remain a long-term supportive factor, though specific verifiable purchases for the current window were not published [2] [14].
Credit & Liquidity
Credit conditions are showing signs of tightening as prolonged high interest rates impact borrowing costs and corporate balance sheets.
- Nonperforming loan ratios have seen slight adjustments in the first quarter of 2026.
- The Federal Reserve announced the upcoming release of the 2026 bank stress test results.
- High yield spreads remain a key indicator of market stress amid economic uncertainty. While systemic liquidity remains adequate, the compounding risks of higher funding costs and potential economic deceleration are prompting a more cautious approach within credit markets [15] [16].
Equity & Volatility Sentiment
Equity markets exhibited increased volatility, reflecting investor anxiety over inflation, interest rates, and geopolitical developments.
- The CBOE Volatility Index (VIX) climbed to approximately 19.9 mid-week before settling near 19.19.
- The S&P 500 experienced significant intraday swings, particularly following the CPI release.
- Tech stocks, specifically the “Magnificent Seven,” exerted downward pressure on broader indices. The transition to a higher volatility regime suggests that markets are repricing risk premiums. Investors are balancing the narrative of a booming economy against the tangible threats of sustained inflation and geopolitical conflict [17] [18].
Geopolitics & Strategic Risk
The Middle East conflict, specifically the direct engagement between the US and Iran, is the dominant geopolitical risk factor currently influencing global markets.
- The US and Iran exchanged strikes for a second consecutive day.
- Iran claims to have hit targets at US bases and threatened closure of the Strait of Hormuz.
- Reports of a potential peace memorandum surfaced, though definitive confirmation remains elusive. The situation remains highly fluid and unpredictable. Any further escalation threatens to cause severe disruptions to global energy supplies, which would cascade into higher inflation and potentially slower economic growth worldwide [19] [20].
Structural & Long-Term Themes
The trend of de-dollarization and the shifting global reserve system continues to unfold quietly but persistently in the background of immediate market noise.
- Central banks globally added 863 tonnes of gold in 2025.
- Nations are actively reducing their dependence on the US dollar as a reserve asset.
- This structural redistribution provides a long-term price floor for gold. The freezing of sovereign assets in recent years has fundamentally altered the risk calculus for central banks. The ongoing accumulation of gold by sovereign institutions underscores a strategic pivot toward assets without counterparty risk [21].
Cross-Asset Interlinkages
- The robust US nonfarm payrolls report directly fueled the rise in Treasury yields, which in turn exerted immense downward pressure on non-yielding precious metals.
- Escalating tensions in the Middle East caused energy prices to spike, directly contributing to the multi-year highs in both CPI and PPI inflation metrics.
- The hotter inflation data solidified the “higher for longer” interest rate narrative, supporting the US dollar and further dampening the appeal of gold and silver.
- Increased geopolitical uncertainty and the repricing of interest rate expectations led to a measurable uptick in equity market volatility (VIX).
- The ECB’s rate hike, driven by war-induced inflation, highlights the global nature of the current economic challenges, though the US dollar maintained its relative strength due to superior domestic growth metrics.
Risk Matrix Snapshot
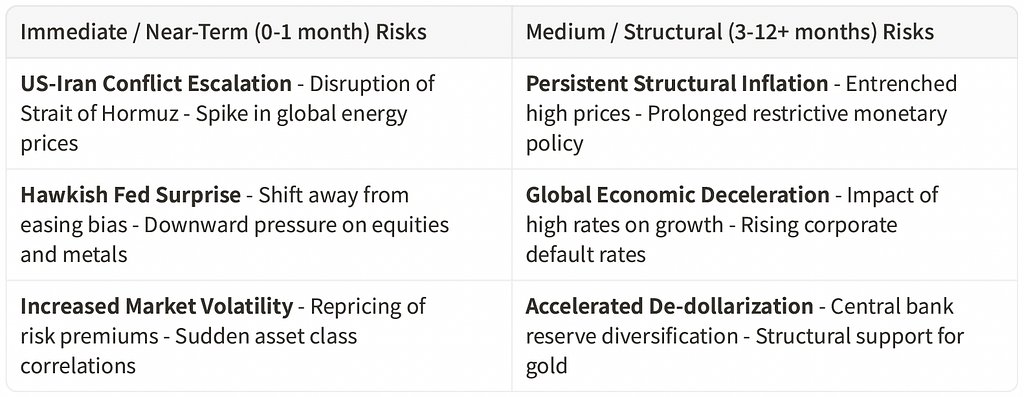
Scenario Watch & Forward Catalysts
- June 16–17: FOMC Meeting. Base Probability: Rates held steady at 3.50%-3.75%. Elevated Probability: Removal of easing bias in policy statement. Note: A hawkish surprise would serve as a potential headwind to bullion.
- June 16: US Retail Sales Data. Base Probability: Moderate consumer spending. Low-Probability Tail: Significant contraction signaling economic slowdown, which could boost safe-haven assets.
- June 18: Bank of England Rate Decision. Base Probability: Rates held steady or minimal cut.
- Ongoing: US-Iran Geopolitical Developments. Elevated Probability: Continued volatility in energy markets based on conflict headlines.
Portfolio Context & Implications
The recent surge in volatility and the sharp repricing of interest rate expectations underscore the challenges of navigating the current macroeconomic environment. The correlation between equities and bonds during inflationary shocks highlights the importance of robust diversification strategies. While higher yields offer attractive income opportunities in fixed income, the persistence of inflation and geopolitical risks suggests that traditional portfolios may face continued headwinds. The recent price action in precious metals, while negative in the short term, presents a complex picture when viewed against the backdrop of structural inflation and shifting global reserve dynamics.
Precious Metals Strategic Thesis
Diversification Attribute
Precious metals historically offer low correlation to traditional financial assets such as equities and bonds. In periods where both stocks and bonds face pressure from persistent inflation and rising yields, allocations to gold and silver can serve to reduce overall portfolio volatility and enhance risk-adjusted returns.
Wealth Protection & Purchasing Power
Gold is widely recognized as a store of value that maintains purchasing power over long horizons. As fiat currencies experience devaluation through persistent inflation, as evidenced by the recent multi-year highs in CPI and PPI, precious metals provide a tangible mechanism for wealth preservation.
Drawdown Mitigation & Crisis Optionality
During acute geopolitical crises or severe market dislocations, gold often exhibits safe-haven characteristics. The ongoing conflict in the Middle East and the associated risks to global energy supplies highlight the value of holding an asset that carries no counterparty risk and is not dependent on the stability of the financial system.
Structural Demand Drivers
The structural shift in global reserve management, characterized by the ongoing de-dollarization trend and consistent central bank gold accumulation, provides a robust foundation for long-term demand. This institutional buying is driven by strategic policy rather than short-term return seeking, creating a resilient price floor.
Allocation Framing
Academic research and historical performance analysis generally support the inclusion of a strategic allocation to precious metals within a diversified portfolio. This allocation is typically viewed as a long-term structural holding designed to enhance resilience and mitigate tail risks, rather than a short-term tactical trade.
Summary Capsule
- Macro Pulse: US inflation re-accelerated to 4.2% in May, driven by energy shocks, while the labor market remained surprisingly robust, adding 172,000 jobs.
- Metals Stance: Precious metals experienced a severe sell-off as rising Treasury yields and a stronger US dollar undermined their short-term appeal.
- Risk Tone: Market sentiment shifted toward a higher volatility regime, balancing a booming domestic economy against significant geopolitical threats.
- Positioning Nuance: The sharp drop in silver prices relative to gold reflects its higher sensitivity to industrial headwinds and speculative liquidation.
- Forward Watch: All eyes are on the upcoming FOMC meeting for signals regarding the future path of interest rates under new Chair Kevin Warsh.
- Structural Theme: Central banks continue to quietly accumulate gold, driven by a strategic desire to reduce reliance on the US dollar and eliminate counterparty risk.
Source List
[1] Fox Business / Bloomberg — US economy added 172,000 jobs in May, beating expectations — June 5, 2026 — https://www.foxbusiness.com/economy/us-jobs-report-may-2026 [2] Investing News Network — Precious Metals News: Gold, Silver, PGMs Prices Slide as Investors Brace for Fed Meeting — June 11, 2026 — https://investingnews.com/precious-metals-price-update/ [3] Bureau of Labor Statistics — Consumer Price Index News Release — June 10, 2026 — https://www.bls.gov/news.release/archives/cpi_06102026.htm [4] Morningstar — European Central Bank Raises Interest Rates and Lifts Inflation Forecasts — June 11, 2026 — https://www.morningstar.com/economy/european-central-bank-raises-interest-rates-lifts-inflation-forecasts [5] Yahoo Finance — US Dollar Index (DX-Y.NYB) Charts, Data & News — June 12, 2026 — https://finance.yahoo.com/quote/DX-Y.NYB/ [6] Al Jazeera — Iran weighs proposed deal but remains wary of US intentions — June 12, 2026 — https://www.aljazeera.com/video/newsfeed/2026/6/12/iran-weighs-proposed-deal-but-remains-wary-of-us-intentions [7] CNN — Inflation is the worst in three years. Kevin Warsh says that’s not the full story — June 11, 2026 — https://www.cnn.com/2026/06/11/economy/inflation-kevin-warsh-federal-reserve [8] Yahoo Finance — CBOE Interest Rate 10 Year T No (^TNX) — June 12, 2026 — https://finance.yahoo.com/quote/%5ETNX/ [9] CNBC — Treasury yields edge higher as traders weigh inflationary pressures — June 8, 2026 — https://www.cnbc.com/2026/06/08/treasury-yields-rise-as-traders-weigh-inflationary-pressures.html [10] MarketWatch — U.S. Dollar Index Jun 2026 Overview — DXM26 — June 11, 2026 — https://www.marketwatch.com/investing/future/dxm26 [11] Reuters — BOJ set to raise key rate to 1.0% in June, 1.25% by year-end — June 10, 2026 — https://www.reuters.com/world/asia-pacific/boj-set-raise-key-rate-10-june-125-by-year-end-2026-06-10/ [12] CNBC — Oil prices fall after U.S. Energy secretary says Hormuz ship traffic is… — June 9, 2026 — https://www.cnbc.com/2026/06/09/oil-prices-iran-war-strait-hormuz-trump-israel-lebanon.html [13] Reuters — Oil settles up nearly $2 after Trump threatens to hit Iran ‘very hard’ — June 10, 2026 — https://www.reuters.com/business/energy/oil-rises-nearly-1-us-launches-new-strikes-against-iran-supply-tightens-2026-06-10/ [14] Yahoo Finance — Silver prices today, Thursday, June 11, 2026: Lowest open since Dec. ’25 following U.S. strikes against Iran — June 11, 2026 — https://finance.yahoo.com/personal-finance/investing/article/silver-prices-today-thursday-june-11-2026-lowest-open-since-dec-25-following-us-strikes-against-iran-111652646.html [15] Federal Reserve Board — Supervision and Regulation Report — June 11, 2026 — https://www.federalreserve.gov/publications/files/202606-supervision-and-regulation-report.pdf [16] Federal Reserve — Federal Reserve Announces June 24 Release Date for 2026 Bank Stress Test Results — June 11, 2026 — https://www.reddragoncanoeclub.org/first-dry/Federal-Reserve-Announces-June-24-Release-Date-for-2026-Bank-Stress-Test-Results-32-228 [17] Yahoo Finance — CBOE Volatility Index (^VIX) Charts, Data & News — June 12, 2026 — https://finance.yahoo.com/quote/%5EVIX/ [18] Yahoo Finance — Big Tech is dragging the S&P 500 lower in June — June 11, 2026 — https://finance.yahoo.com/video/big-tech-is-dragging-the-sp-500-lower-in-june-193121554.html [19] BBC — Watch: Has Donald Trump lost control of the Iran war? — June 9, 2026 — https://www.bbc.com/news/videos/ckg8nke01g5o [20] Reuters — U.S.-Iran peace memorandum could be signed on Sunday — June 12, 2026 — https://www.reuters.com/world/middle-east/trump-says-iran-war-deal-close-strait-hormuz-tensions-linger-2026-06-12/ [21] FXStreet — Central bank Gold buying and the quiet acceleration of De-Dollarization — June 8, 2026 — https://www.fxstreet.com/education/central-bank-gold-buying-and-the-quiet-acceleration-of-de-dollarization-202606081738 [22] CNBC — Consumer prices rose 4.2% annually in May, highest in three years — June 10, 2026 — https://www.cnbc.com/2026/06/10/cpi-inflation-report-may-2026.html [23] J.P. Morgan Wealth Management / Chase — What to expect at Kevin Warsh’s first Federal Reserve meeting as chair — June 8, 2026 — https://www.chase.com/personal/investments/learning-and-insights/article/kevin-warsh-first-federal-reserve-meeting-as-chair-june-2026 [24] Bloomberg — US Hiring Surged in May, Boosting Bets on Fed Rate Hike — June 5, 2026 — https://www.bloomberg.com/news/articles/2026-06-05/us-adds-172-000-jobs-in-may-beating-all-economists-estimates
Methodology & Notes
This report compiles publicly available data and news from credible financial and geopolitical sources for the period of June 5, 2026, 00:00:00 EST through June 12, 2026, 11:00:00 EST. Price ranges provided for precious metals are approximations based on spot and front-month futures trading during the coverage window. The timeline incorporates scheduled data releases, including Friday 10:00 AM EST metrics where available. This edition was run as an Off-Cycle report prior to the standard 11:00 AM EST Friday publication time.
Disclosure
This report is for informational purposes only and does not constitute investment advice, a recommendation, an offer, or a solicitation to buy or sell any financial instrument. The views expressed are based on publicly available information believed to be reliable, but accuracy or completeness cannot be guaranteed. Past performance is not indicative of future results. Readers should conduct their own analysis and consult qualified professionals before making any financial decisions.
#WiseGold #WealthPreservation #Geopolitics #CentralBanks #DeDollarization #InterestRates #SafeHaven #FinancialAdvisors #FamilyOffice #WealthManagement #PortfolioDiversification #MoneyManagement #WiseGoldCapital